Mynd:Binary logarithm plot with ticks.svg

Size of this PNG preview of this SVG file: 408 × 325 pixels. Aðrar upploysnir: 301 × 240 pixels | 603 × 480 pixels | 964 × 768 pixels | 1.280 × 1.020 pixels | 2.560 × 2.039 pixels.
Upprunafíla (SVG fíle, nominelt 408 × 325 pixel, fíle stødd: 56 KB)
Samandráttur
| Frágreiðing |
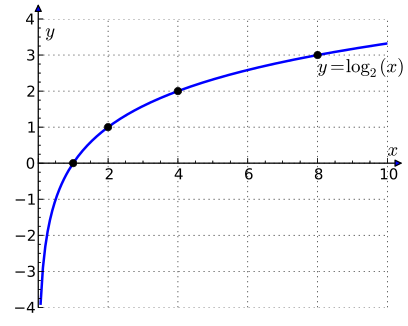
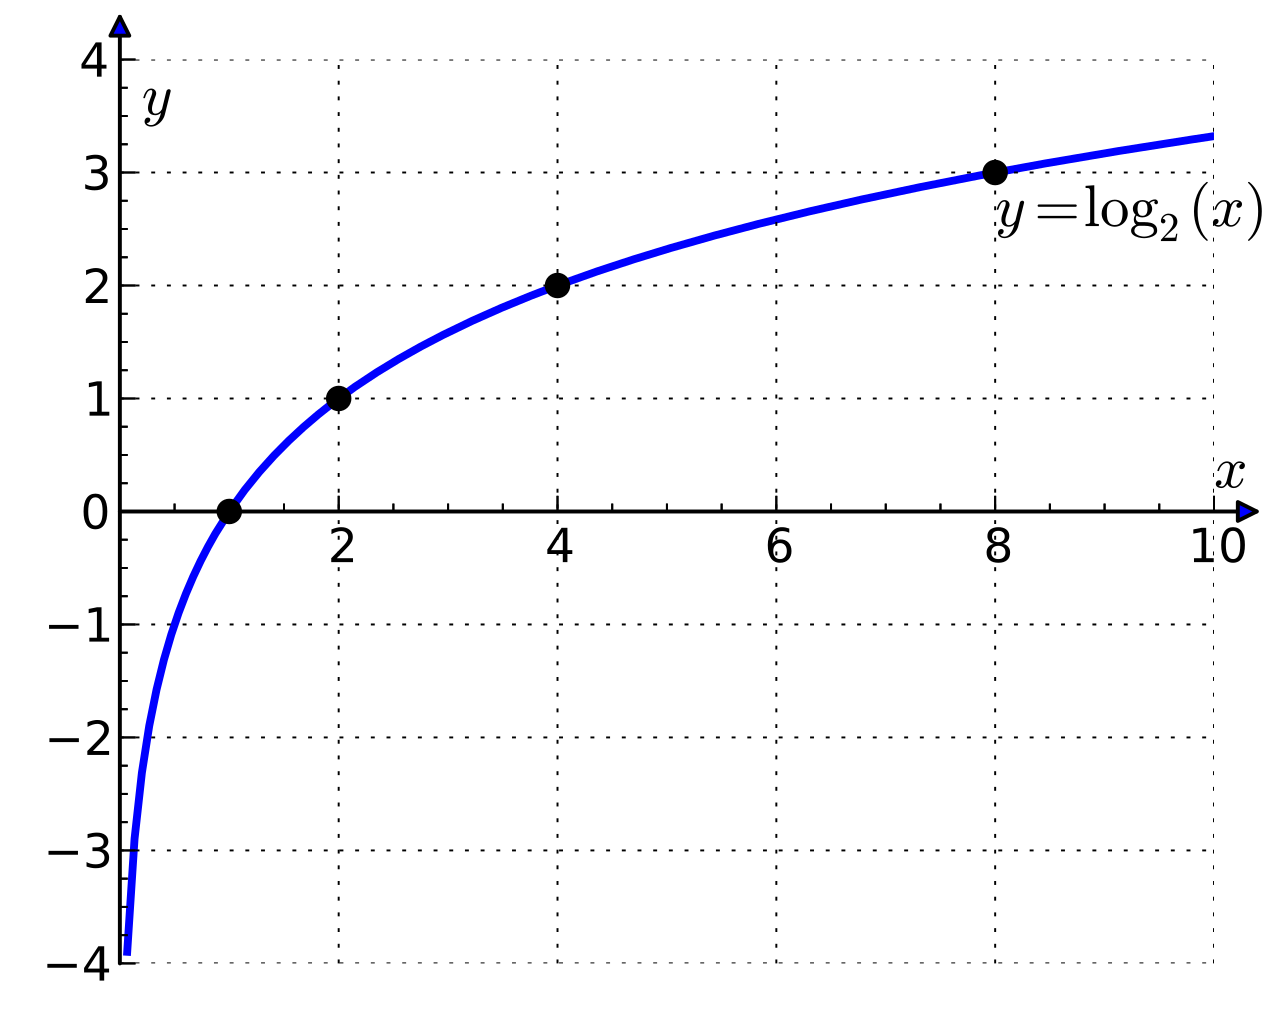
English: Binary logarithm plot with ticks. |
||
| Dagur | |||
| Kelda | Egið verk | ||
| Høvundur | Krishnavedala | ||
| Other versions | File:Binary_logarithm_plot_with_ticks.png | ||
| SVG genesis | This plot was created with Matplotlib. | ||
| Source code | Python code
|
Lisensur
I, the copyright holder of this work, hereby publish it under the following licenses:
Henda fíla er gjørd atkomulig undir Creative Commons Navngev-Deil á sama hátt 3.0 Unported loyvinum.
- Tú ert vælkomin til:
- at deila – at avrita, breiða út og senda verkið
- at remiksa – at tillaga ella broyta verkið
- Undir hesum treytum:
- ognan – Tú mást ognarskrivað verkið á ein slíkan hátt sum er útgreinaður av høvundanum ella lisenseigaranum (men ikki á nakran hátt ið kundi bent á at hesin hevur góðkent teg ella tína nýtslu av verkinum).
- deil undir somu treytum – Um tú broytir, evnar til ella byggir víðari á hetta verk, so kanst tú bert útgeva verkið undir somu ella líkandi lisensi sum hesin.

|
Loyvi verður givi at avrita, bera út og/ella broyta hetta skjal undir treytunum hjá GNU Free Documentation License, versión 1.2 ella einhvør seinni versjón ið er útgivin av Free Software Foundation; uttan nakað óbroytiligt brot, uttan forsíðutekst og uttan baksíðutekst. Eitt avrit av loyvinum er tikið við í brotinum ið nevnist GNU Free Documentation License. |
Tú kanst velja tann lisens ið tú ynskir.
Søgan hjá fíluni
Trýst á dato/tíð fyri at síggja fíluna, sum hon sá út tá.
| Dagur/Tíð | Lítil mynd | Dimensjónir | Brúkari | Viðmerking | |
|---|---|---|---|---|---|
| streymur | 5. jun 2011 kl. 22:51 | | 408 × 325 (56 KB) | Krishnavedala | removed one '0' at the origin and kept the texts big enough like the previous edit |
| 5. jun 2011 kl. 15:13 |  | 408 × 325 (76 KB) | JohnBlackburne | Make axis labels bigger and clearer, so readable at thumbnail size | |
| 5. jun 2011 kl. 09:59 |  | 408 × 325 (56 KB) | Krishnavedala | {{Information |Description ={{en|1=Binary logarithm plot with ticks. Created using python. <syntaxhighlight lang="python"> from numpy import linspace,log2 from matplotlib.pyplot import * from mpl_toolkits.axes_grid |
Myndarslóðir
Hesar síður slóða til hesa mynd:
Alheims fílunýtsla
Aðrar wkiir brúka hesa fílu:
- Nýtsla á as.wikipedia.org
- Nýtsla á ba.wikipedia.org
- Nýtsla á be-tarask.wikipedia.org
- Nýtsla á be.wikipedia.org
- Nýtsla á bg.wikipedia.org
- Nýtsla á bn.wikipedia.org
- Nýtsla á bs.wikipedia.org
- Nýtsla á bxr.wikipedia.org
- Nýtsla á ca.wikipedia.org
- Nýtsla á ckb.wikipedia.org
- Nýtsla á crh.wikipedia.org
- Nýtsla á cv.wikipedia.org
- Nýtsla á cy.wikipedia.org
- Nýtsla á de.wikibooks.org
- Mathematrix: AT BRP/ Theorie/ Reifeniveau 4
- Mathematrix: MA TER/ Theorie/ Funktionen
- Mathematrix: AT BRP/ Theorie nach Thema/ Funktionen
- Mathematrix: AT AHS/ Theorie nach Thema/ Funktionen
- Mathematrix: AT AHS/ Theorie/ Klasse 6
- Mathematrix: BY GYM/ Theorie/ Klasse 10
- Mathematrix: BY GYM/ Theorie nach Thema/ Funktionen
- Nýtsla á diq.wikipedia.org
- Nýtsla á el.wikipedia.org
- Nýtsla á eml.wikipedia.org
- Nýtsla á en.wikipedia.org
- Nýtsla á en.wikibooks.org
- Nýtsla á et.wikipedia.org
- Nýtsla á fa.wikipedia.org
- Nýtsla á fi.wikipedia.org
- Nýtsla á gl.wikipedia.org
- Nýtsla á hy.wikipedia.org
- Nýtsla á id.wikipedia.org
- Nýtsla á it.wikipedia.org
- Nýtsla á ko.wikipedia.org
- Nýtsla á lmo.wikipedia.org
- Nýtsla á lt.wikipedia.org
- Nýtsla á mk.wikipedia.org
- Nýtsla á ml.wikipedia.org
- Nýtsla á ms.wikipedia.org
Vís meiri globala nýtslu av hesi fílu.