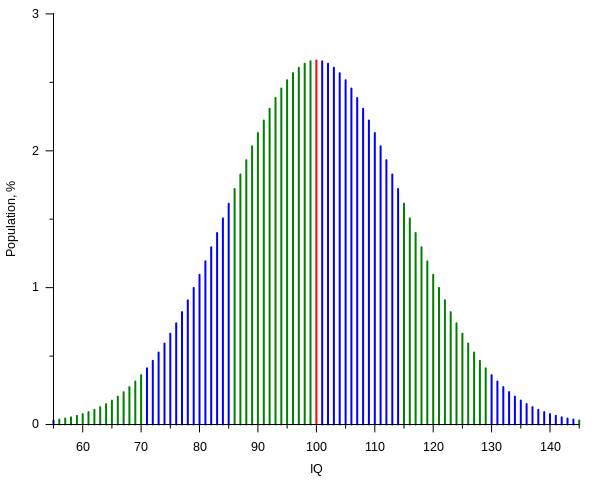
Mynd:IQ curve.svg

Size of this PNG preview of this SVG file: 600 × 480 pixels. Aðrar upploysnir: 300 × 240 pixels | 960 × 768 pixels | 1.280 × 1.024 pixels | 2.560 × 2.048 pixels.
Upprunafíla (SVG fíle, nominelt 600 × 480 pixel, fíle stødd: 9 KB)
Søgan hjá fíluni
Trýst á dato/tíð fyri at síggja fíluna, sum hon sá út tá.
| Dagur/Tíð | Lítil mynd | Dimensjónir | Brúkari | Viðmerking | |
|---|---|---|---|---|---|
| streymur | 26. nov 2020 kl. 23:11 |  | 600 × 480 (9 KB) | Paranaja | Reverted to version as of 21:27, 2 November 2012 (UTC) |
| 2. nov 2012 kl. 21:27 |  | 600 × 480 (9 KB) | Mikhail Ryazanov | IQ values are now integers; gnuplot-only approach | |
| 6. des 2006 kl. 09:20 |  | 600 × 480 (12 KB) | Alejo2083 | {{Information |Description= The IQ test is made so that most of the people will score 100 and the distribution will have the shape of a Gaussian function, with a standard deviation of 15. The plot shows the percentage of people getting a score versus the |
Myndarslóðir
Ongar síður slóða til hesa myndina.
Alheims fílunýtsla
Aðrar wkiir brúka hesa fílu:
- Nýtsla á ar.wikipedia.org
- Nýtsla á ast.wikipedia.org
- Nýtsla á az.wikipedia.org
- Nýtsla á ba.wikipedia.org
- Nýtsla á be-tarask.wikipedia.org
- Nýtsla á be.wikipedia.org
- Nýtsla á ca.wikipedia.org
- Nýtsla á cs.wikipedia.org
- Nýtsla á da.wikipedia.org
- Nýtsla á de.wikipedia.org
- Intelligenzquotient
- Normwert
- Wikipedia:WikiProjekt Psychologie/Archiv
- Benutzer:SonniWP/Hochbegabung
- Kritik am Intelligenzbegriff
- The Bell Curve
- Benutzer:Rainbowfish/Bilder
- Quantitative Psychologie
- Intelligenzprofil
- Benutzer:LauM Architektur/Babel
- Benutzer:LauM Architektur/Babel/Überdurchschnittlicher IQ
- Nýtsla á de.wikibooks.org
- Elementarwissen medizinische Psychologie und medizinische Soziologie: Theoretisch-psychologische Grundlagen
- Elementarwissen medizinische Psychologie und medizinische Soziologie/ Druckversion
- Elementarwissen medizinische Psychologie und medizinische Soziologie/ Test
- Benutzer:OnkelDagobert:Wikilinks:Psychologie
- Nýtsla á de.wikiversity.org
- Nýtsla á en.wikipedia.org
- User:Michael Hardy
- User:Robinh
- User:Itsnotvalid
- User:M.e
- User:Quandaryus
- User:Astronouth7303
- User:Mattman723
- User:Iothiania
- User:Octalc0de
- Portal:Mathematics/Featured picture archive
- User:Dirknachbar
- User talk:BlaiseFEgan
- User:Albatross2147
- User:Klortho
- User:Kvasir
- User:Spellcheck
- User:Heptadecagram
- User:Patrick1982
- User:NeonMerlin/boxes
- User:Cswrye
Vís meiri globala nýtslu av hesi fílu.
